Welcome to our guide on Prometheus and Grafana, your tools for achieving top-notch system monitoring and visualisation. Whether you’re a novice venturing into the world of DevOps or a seasoned pro looking to supercharge your monitoring capabilities, this blog has it all.
The Significance of Proactive Monitoring
In the world of DevOps, monitoring stands as a crucial pillar for ensuring the seamless operation of applications and systems. Proactive monitoring takes center stage, consistently observing infrastructure performance and health to identify and address issues before they escalate. This practice greatly enhances the overall success of your DevOps processes.
Monitoring is the compass that allows you to navigate the performance and well-being of your systems and applications. It empowers you to identify and tackle issues before they snowball into outages or performance bottlenecks.
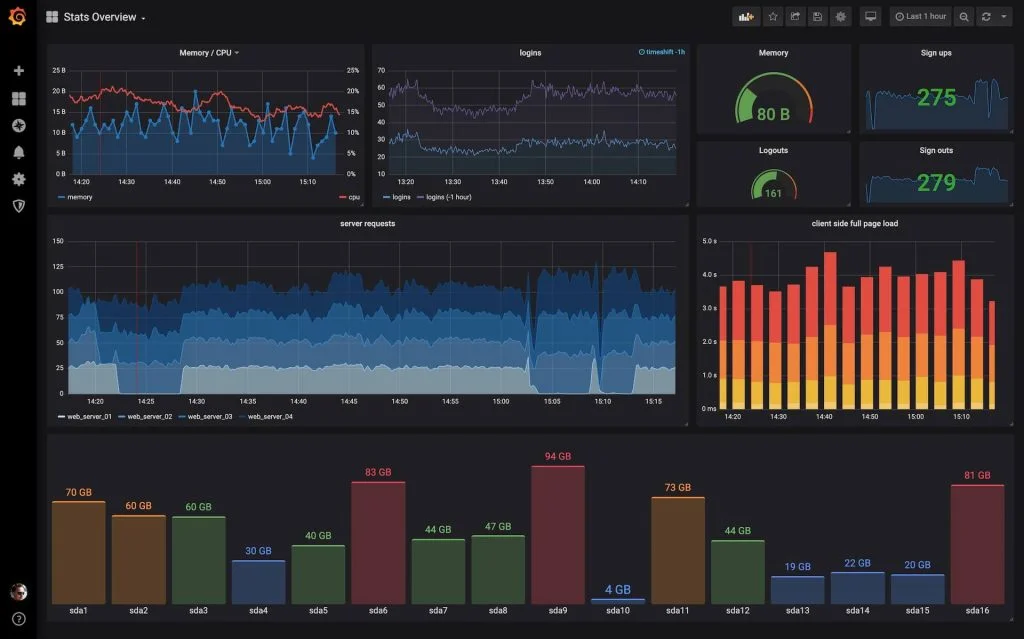
Dashboards, on the other hand, transform your monitoring data into a visual masterpiece. They provide an intuitive platform for tracking trends, recognizing patterns, and swiftly spotting anomalies.
By monitoring your systems and applications, you can nip potential problems in the bud. This can lead to significant improvements in reliability.
Outages and performance degradation can lead to lost revenue and productivity. By monitoring your systems and applications, you can reduce the risk of these problems and save money.
Dashboards provide a single place where you can view the performance and health of all of your systems and applications. This can help you to gain a better understanding of your overall infrastructure and how it is performing.
The data you collect from monitoring can be used to make informed decisions about your infrastructure and applications. For example, you can use this data to identify areas where you need to improve performance or to scale your infrastructure.
Challenges in Monitoring and Visualization
Monitoring and visualisation come with their share of challenges:
One of the challenges of monitoring is collecting data from a variety of sources. This can be difficult, especially if you have a complex infrastructure.
Another challenge is storing and managing the monitoring data. This can be expensive and time-consuming, especially if you have a large amount of data.
Finally, it can be difficult to create dashboards that are both informative and easy to use.
Here are some specific challenges in monitoring and visualisation:
- Data collection: A significant challenge in monitoring is the intricate task of collecting data from diverse sources. This complexity becomes especially pronounced in environments characterized by their intricacy, such as hybrid or multi-cloud setups. Dealing with this data variety can be a formidable hurdle for teams striving to maintain a clear operational picture.
- Data storage: The sheer volume of monitoring data generated can pose substantial challenges. Storing and managing this data is not just an operational task but can also be an economic concern, particularly when dealing with large datasets. The expense and time involved in managing this data can become a significant consideration for organizations.
- Data visualisation: Crafting effective dashboards that strike the right balance between informativeness and user-friendliness is another challenge. These dashboards must be visually appealing to engage users, but at the same time, they need to be intuitively designed for easy comprehension and use. Achieving this balance requires careful thought and design expertise.
Enter Prometheus and Grafana as a solution

Prometheus and Grafana are two open-source tools that can be used to solve the challenges of monitoring and dashboards.
Prometheus is a monitoring system that collects and stores time series data. It can scrape metrics from a variety of sources, including software, infrastructure, and cloud services.
Grafana is a data visualisation and monitoring platform. It can be used to create dashboards that visualise metrics from Prometheus and other data sources. Grafana also provides alerting capabilities, so you can be notified when your metrics go outside of a certain range.
Prometheus plus Grafana are a powerful combination for monitoring your infrastructure and applications. They are both open-source and easy to use, and they can be scaled to meet the needs of even the largest organisations.
Here are some specific ways that Prometheus and Grafana solve the challenges of monitoring and visualisation:
- Effortless Data collection: Prometheus effortlessly gathers metrics from a diverse range of sources, ensuring you have a comprehensive view of your infrastructure.
- Optimised Data storage: Prometheus stores metrics in a time series database. Time series databases are specifically designed to store and manage time-stamped data. This makes it efficient and cost-effective to store and manage large amounts of monitoring data.
- Flexible Data visualisation: Grafana provides a variety of visualisation options, so you can create dashboards that are tailored to your specific needs. Dashboards can be customised with different types of charts, graphs, and other visualisations. Grafana also provides a variety of pre-built dashboards that you can use to get started quickly.
Overall, Prometheus and Grafana are a powerful and flexible solution for monitoring and dashboards. They can be used to solve the challenges of data collection, data storage, and data visualisation. Embrace this dynamic duo to unlock the full potential of your monitoring and visualisation endeavours.
Now that you’ve grasped the significance of monitoring and visualization, it’s time to dive deeper into the powerful tools that make it all possible. In our next blog, we’ll explore the world of Prometheus, its capabilities, and how it addresses the challenges of monitoring. Don’t miss out on this essential knowledge! Explore Prometheus: The Heart of Effective System Monitoring.