What is Grafana?
Grafana, an open-source interactive data visualization platform developed by Grafana Labs, empowers users to gain insights from their data by presenting it through unified charts and graphs within one or multiple dashboards. This approach simplifies data interpretation and comprehension. Moreover, Grafana facilitates querying and setting alerts on data and metrics, regardless of their source – be it traditional server environments, Kubernetes clusters, various cloud services, and more. This versatility enables efficient data analysis, trend identification, and anomaly detection, ultimately enhancing process efficiency.
Grafana is founded on the principles of openness and accessibility. It champions the idea that data should be readily available to everyone within an organization, not confined to a select few. This ethos fosters a culture where data becomes easily discoverable and usable by anyone who requires it. As a result, teams are empowered to be more transparent, innovative, and collaborative in their data-driven endeavors.
Why Grafana?
Grafana serves a multitude of purposes. It excels at visualizing metrics, facilitating alerting systems, and fostering comprehensive comprehension of data from diverse sources, thanks to its versatile plugin architecture. Here are a few notable applications:
Effortlessly depict a machine’s CPU, memory, network usage, and other resource utilization by harnessing Prometheus and Grafana.
Swiftly create visualizations and set up alerts for detecting high volumes of incoming web requests in your web application.
Keep a watchful eye on the overall health and performance of the various components within your platform, spanning APIs, front-end applications, databases, and more.
These are just a glimpse of the possibilities Grafana offers; its utility extends far beyond these scenarios.
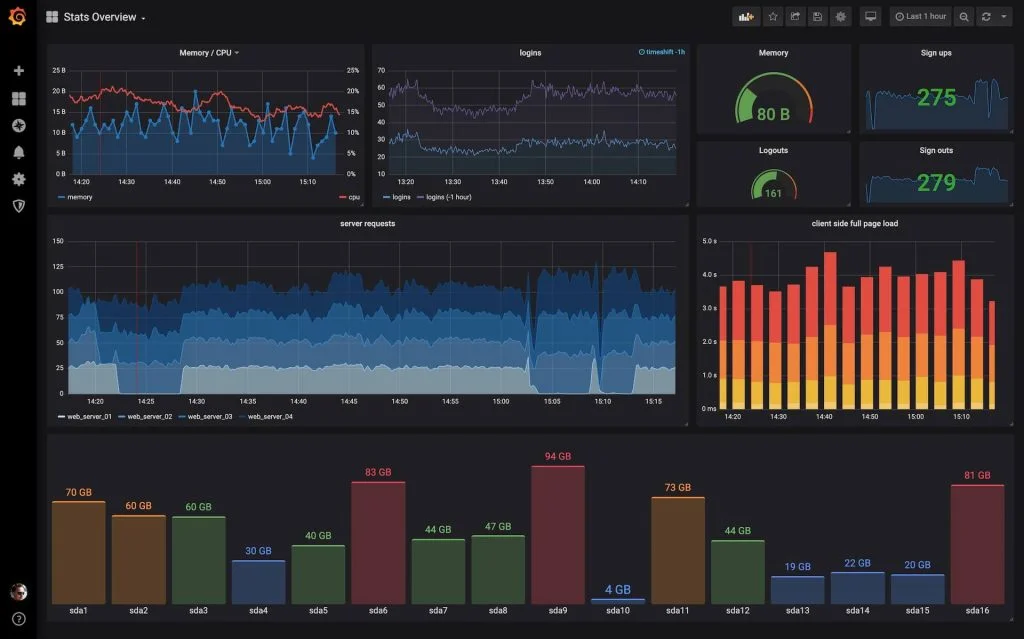
Here’s an illustrative dashboard example that displays metrics such as memory usage, CPU utilization, logouts, sign-ups, sign-outs, server requests, and more. It’s important to note that the specific metrics and statistics showcased on the dashboard can vary according to the unique requirements of your use case.
Dashboard and Features
Grafana’s dashboards elevate the understanding of data collected from diverse sources. These dashboards can be easily shared with team members and even across different teams, fostering collaboration and enabling extensive data exploration. Users have the flexibility to construct dashboards tailored to their needs and customize panels to create desired visualizations, leveraging advanced querying and transformation capabilities.
In situations where pinpointing the cause of an incident or unexpected system behavior swiftly is paramount, Grafana proves invaluable. It offers seamless data visualization and sharing capabilities among teams and team members, expediting the problem-solving process.
Insights gleaned from Grafana dashboards can be shared
- Across the Company: Facilitating dissemination even to colleagues who may not be Grafana users themselves.
- Within the Grafana Community: Extending the reach of insights to the global Grafana user community.
- Across Devices and Locations: Users can access their dashboards on various devices, ensuring data visibility wherever they are.
Key Features of Grafana Include
- Panels: Enabling users to visualize data in diverse ways, from histograms and graphs to geomaps and heatmaps.
- Plugins: Supporting real-time rendering of data via user-friendly APIs through panel plugins that seamlessly integrate with existing data sources. No data migration is required. Additionally, users can create data source plugins to fetch metrics from custom APIs.
- Alerts: A unified interface for creating, consolidating, and managing alerts across the system.
- Transformations: Offering the ability to rename, summarise, combine, and perform calculations across data sources and queries.
- Annotations: Utilising rich events from different data sources to annotate graphs, providing valuable context.
- Panel Editor: Providing a consistent user interface for configuring and customizing panels to suit specific needs.
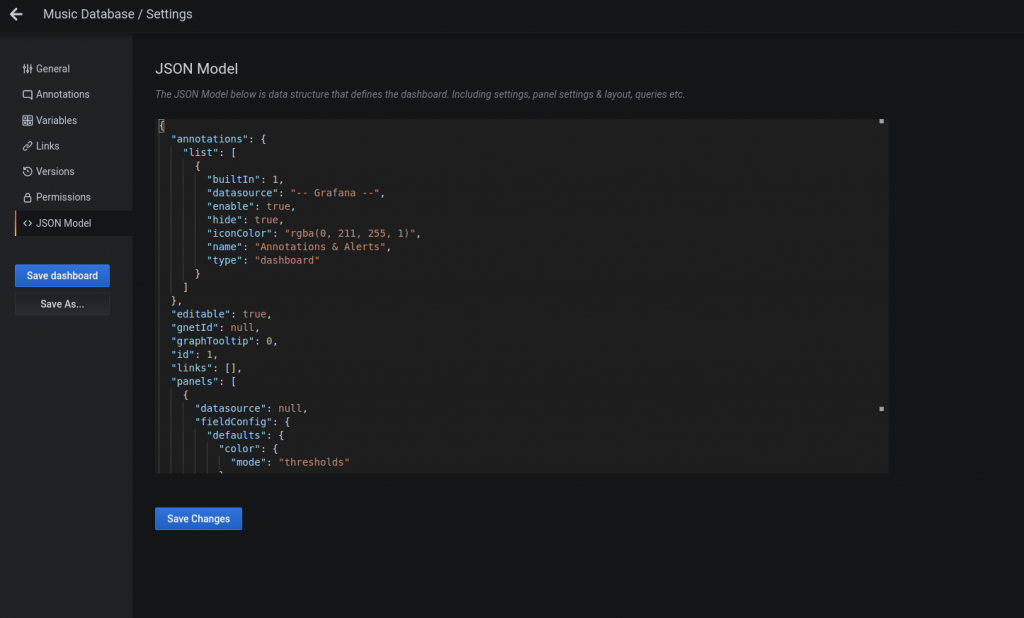
- Easily share dashboards: A feature that makes Grafana really popular is the ability to easily share dashboards with others. To export your dashboard, select the cog icon at the top right of your dashboard. The tooltip will read Dashboard Settings. Select JSON Model from the left navigation menu and you can see your dashboard as JSON. Sharing your dashboard is as simple as saving this file and passing it to someone else to load into their instance. Below is how my dashboard looks as JSON.
Strengths of Grafana
Grafana possesses several noteworthy strengths, making it a versatile tool for data visualization and analysis:
- Appealing Dashboards and Visualizations: Grafana excels in creating visually captivating and highly customizable dashboards. Its interactive data visualization platform simplifies data analysis, enabling users to track performance, identify trends, and pinpoint irregularities effectively.
- Multi-Cloud Monitoring: A significant advantage of Grafana is its ability to monitor multiple cloud platforms. It empowers users to collect and visualize metrics from leading cloud providers like Amazon AWS (CloudWatch), Microsoft Azure (Monitor), and Google Cloud.
- Extensive Integrations: Grafana’s compatibility extends to a wide array of third-party tools through plugins. In addition to cloud data sources, it seamlessly integrates with popular solutions such as Prometheus, InfluxDB, MySQL, Splunk, and Elasticsearch. Grafana also offers integrations via its Grafana agent, which can be installed on various platforms, including Linux hosts, Windows systems, Nginx servers, Kubernetes clusters, and more.
Limitations of Grafana
While Grafana excels in many areas, it does come with certain limitations, primarily related to data handling:
Data Collection and Storage Limitations: Grafana’s primary strength lies in graphing and dashboard creation, but it falls short when it comes to data sources. Although it can independently collect time series data from specific types of infrastructure or applications through agents, it relies on external storage backends as data sources. In other words, Grafana necessitates integration with third-party solutions such as Prometheus, InfluxDB, MySQL, Azure Monitor, or Amazon CloudWatch for data feeding and storage.
What is not Grafana?
Grafana is not a data collection and storage tool. It does not provide direct data collection and storage as tools like Prometheus.
Grafana vs. Prometheus: what are their differences?
Both are open-source and free solutions built to improve the monitoring of time-series data. On the one hand, Grafana is a leader in metrics visualization, while Prometheus is better for its metrics data collection and storage. Both tools can be combined into a robust monitoring solution suitable for monitoring all sorts of infrastructure and applications.
Conclusion
- In summary, Grafana is a powerful open-source data visualization platform that empowers users to gain valuable insights from their data. Its strengths lie in creating visually appealing and customizable dashboards, supporting multi-cloud monitoring, and offering extensive integrations with various data sources. Grafana’s commitment to openness and accessibility fosters a culture of data-driven innovation and collaboration within organizations.
- However, it’s essential to understand that Grafana is not a data collection and storage tool; it relies on external data sources for feeding and storage, making it a perfect companion for solutions like Prometheus.
In the upcoming blog, we will delve deeper into the synergy between Prometheus and Grafana, exploring how this dynamic duo can create a comprehensive monitoring solution. Don't miss out on this exciting journey of optimizing your infrastructure and applications with Prometheus and Grafana!