A Roadmap for This Blog
We’ll take a deep dive into Prometheus, covering the following key areas:
- What is Prometheus?
- Features of Prometheus
- Components of Prometheus
- Prometheus Architecture
- When to Use Prometheus
- When Not to Use Prometheus
What is Prometheus?
Prometheus, originally created at SoundCloud in 2012, is an open-source toolkit for system monitoring and alerting. Over the years, it has gained wide adoption across various companies and organizations. This project boasts an active community of developers and users and has transitioned into a self-sustained open-source initiative, detached from any specific corporate entity. In 2016, Prometheus underscored its independent status and clarified its governance by becoming the second project hosted by the Cloud Native Computing Foundation, following Kubernetes.
Prometheus functions by collecting and storing metrics as time series data, which means it records metric information with associated timestamps and optional key-value pairs known as labels.
Features
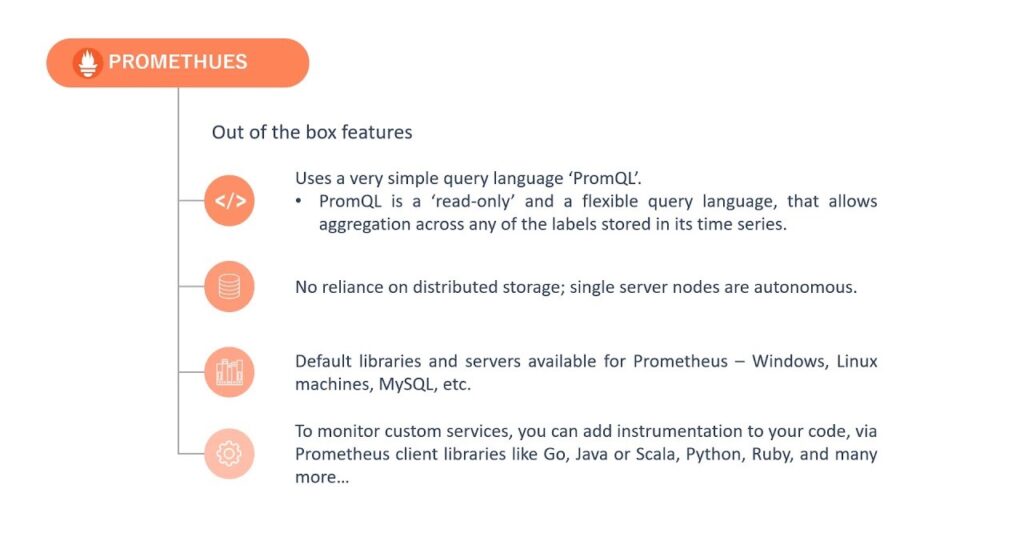
- Multidimensional Data Model: Utilises a versatile data model, organizing time series data with metric names and associated key/value pairs.
- PromQL: Employs PromQL, a flexible query language designed to harness this multi-dimensional structure effectively.
- Distributed Storage Independence: Operates without reliance on distributed storage; individual server nodes function autonomously.
- Pull Model for Time Series Collection: Collects time series data through a pull model over HTTP, streamlining data retrieval.
- Support for Push Mechanisms: Facilitates time series data pushing through an intermediary gateway, enhancing flexibility.
- Dynamic Target Discovery: Employs service discovery or static configuration to identify and manage data collection targets.
- Graphing and Dashboarding: Provides multiple modes for graphing and creating dashboards, ensuring diverse visualization options.
Components
- Main Prometheus Server: This core component is responsible for collecting and storing time series data by scraping various targets.
- Client Libraries: These libraries enable the instrumentation of application code, making it compatible with Prometheus.
- Push Gateway: Designed to support short-lived jobs, the push gateway plays a crucial role in the ecosystem.
- Special-Purpose Exporters: These exporters are tailored for specific services like HAProxy, StatsD, Graphite, and others, facilitating data collection from diverse sources.
- Alertmanager: This component is dedicated to managing and handling alerts, ensuring timely notifications.
- Support Tools: Various auxiliary tools complement the ecosystem, enhancing its functionality.
Most of the Prometheus components are written in Go, simplifying their development and deployment as static binaries.
Architecture
Here is a simplified diagram depicting the architecture of Prometheus and some of the selected ecosystem components:
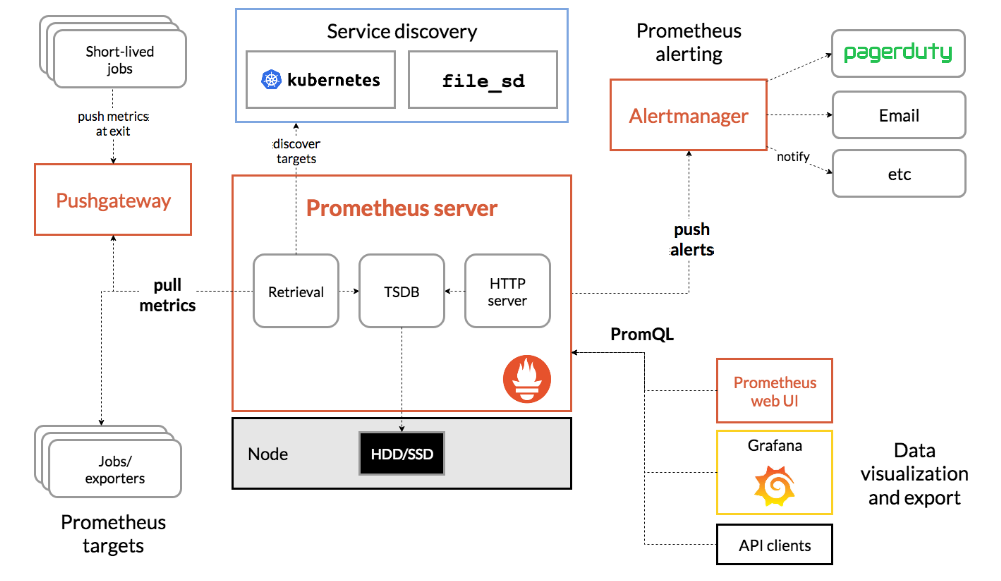
Prometheus Server
- The Prometheus server serves as the central hub for Prometheus services or clusters. Its primary function is to gather multi-dimensional time series data, a process known as scraping, and subsequently analyze and aggregate this data.
- Time series data is collected at fixed time intervals, and access to metrics is achieved through metric names or optional key-value pairs. Labels play a crucial role in distinguishing between different metrics, particularly when you need to derive specific results based on a particular value. By applying filters to the collected metrics, you can create additional time series.
- For instance, consider tracking HTTP requests for various URLs within your application. Instead of creating separate metrics like http_requests_login, http_requests_logout, http_requests_adduser, and http_requests_comment for different paths (e.g., login, logout, user, comment), you can employ labels. By adding a “path” attribute, such as http_request__total(path=”/login”), you can easily access data for specific endpoints. To view data for the overall application, simply remove the path variable.
- The beauty of Prometheus lies in its automatic pulling of metrics from the targets, eliminating the need for users to manually push metrics for analysis. This streamlined approach simplifies the client’s task, as they only need to expose metrics in a manner accessible to Prometheus, typically by creating an HTTP endpoint with “/metrics” to provide the complete metric set.
Push Gateway
- The Prometheus server, while capable, may not scrape all types of metrics on its own, requiring additional mechanisms. Enter the Prometheus Gateway, an intermediary source designed to handle metrics from jobs that cannot be scraped using standard methods. However, there are some considerations to keep in mind when using the Prometheus Gateway:
- Potential Point of Failure: When multiple instances are opened through a Prometheus Gateway, it can become a potential point of failure and create bottlenecks.
- Lack of Automatic Health Monitoring: Prometheus automatic instance health monitoring is not available when using the push gateway.
- Data Exposure: The push gateway always exposes the collected data to Prometheus for any reason, and manual deletion of this information from the Gateway’s API is not possible.
- Lifecycle Differences: In cases where multiple instances of a job employ an instance label to differentiate their metrics in the push gateway, these metrics persist even after the original entity is deleted. This is because the lifecycle of an instance in the push gateway differs from that of the actual process. In contrast, in Prometheus’ classical pull model, metrics are deleted when the original instance is removed.
- The push gateway proves useful in scenarios involving service-level batch jobs that are not semantically tied to a specific job or machine. For instance, tasks like system-wide number deletion should not include machine or instance labels, as these labels can decouple the lifecycle of specific machines or instances from the pushed metrics.
Alertmanager
- Alertmanager plays a pivotal role in managing alerts generated by clients. Its responsibilities encompass deduplication, grouping similar alerts, and routing them to the appropriate channels, such as email, PagerDuty, Opsgenie, and more. Additionally, it decides when to suppress alerts and when not to.
- When alerts are received from a client, such as the Prometheus Server, several actions can be taken. Similar notifications can be grouped together to avoid repetitive displays. Notifications can also be muted if necessary.
- During network partitions, where multiple instances are active, Alertmanager comes into play. In such scenarios, when over half of the instances fail to reach the database, alerting rules trigger alerts for each instance experiencing this issue. Alertmanager enables the configuration of these alerts to be consolidated into a single alert for instances of the same type, reducing redundancy.
- Grouping: Grouping is akin to how notifications from the same app are often grouped together on your smartphone. It consolidates notifications of a similar nature into one, alleviating the server’s load by reducing the need to fire numerous alerts simultaneously. The configuration file specifies the grouping settings and their timing through a routing tree.
- Inhibition: Inhibition involves suppressing one notification when other alerts are already active. For instance, if an alert signals that a cluster is unreachable, Alertmanager can temporarily halt all alerts related to that cluster, preventing an influx of unrelated alerts. The configuration file governs inhibition properties.
- Silence: Silence temporarily mutes alerts for a specific duration using matching criteria like regex matching. Incoming alerts are compared with previous alerts based on defined properties, and if they match, no new notification is sent. Silence can be configured via the Alertmanager’s web interface.
To configure Alertmanager with Prometheus, you need to inform Prometheus about how to communicate with Alertmanager.
When should be used
Prometheus excels at recording purely numeric time series data, making it versatile for both machine-centric monitoring and the dynamic needs of service-oriented architectures. In the realm of microservices, its robust support for multi-dimensional data collection and querying stands out as a key advantage.
Designed with a strong focus on reliability, Prometheus serves as a dependable resource during system outages, enabling swift problem diagnosis. Each Prometheus server operates independently, without dependency on network storage or external remote services. This self-contained nature ensures that you can rely on Prometheus even when other parts of your infrastructure are experiencing issues, all without the need for extensive setup or additional infrastructure.
When not to be used
Prometheus prioritizes reliability by ensuring that you can access system statistics even in the face of failure conditions. However, if you require 100% accuracy, such as for per-request billing, Prometheus may not be the most suitable choice. The data it collects might not offer the level of detail and completeness necessary for such precision. In such instances, it’s advisable to opt for an alternative system designed explicitly for collecting and analyzing data for billing purposes, while still utilizing Prometheus effectively for the broader scope of your monitoring needs.
Now that you've gained a solid understanding of Prometheus, it's time to explore the complementary tool that brings your monitoring data to life. “Refer to the link to blog 3 here” We'll delve into the world of Grafana, the ultimate platform for data visualization and dashboard creation. Discover how Grafana complements Prometheus to provide a holistic monitoring and visualization solution. So, stay tuned and continue your journey into the realm of Prometheus and Grafana!