DevOps

Grafana’s Visual Symphony: A Guide to Data Visualization

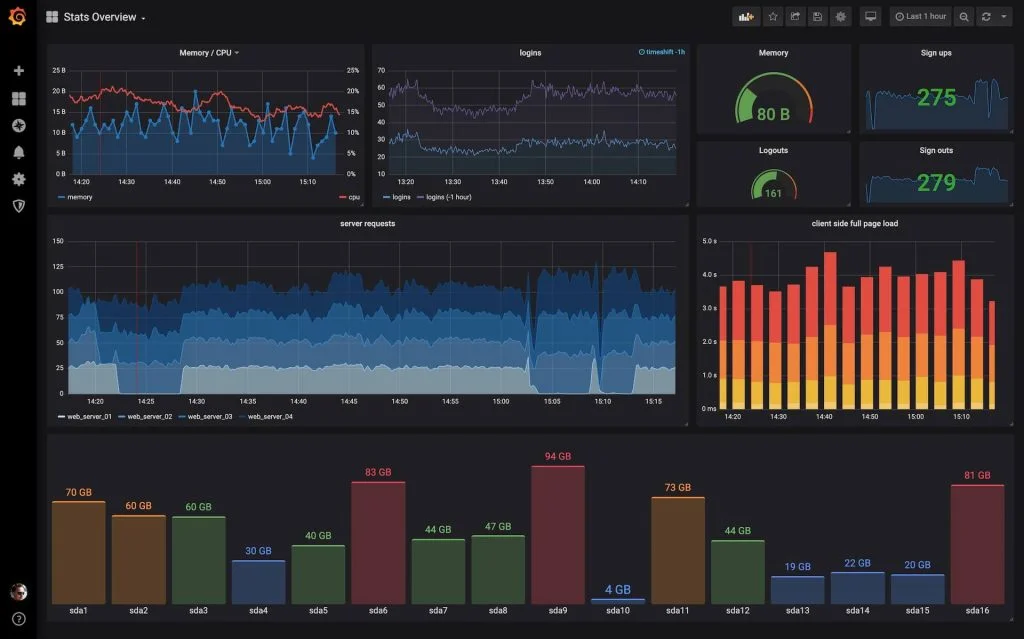
What is Grafana? Grafana, an open-source interactive data visualization platform developed by Grafana Labs, empowers users to gain insights from their data by presenting it through unified charts and graphs within one or multiple dashboards. This approach simplifies data interpretation and comprehension. Moreover, Grafana facilitates querying and setting alerts on data and metrics, regardless of …

Grafana’s Visual Symphony: A Guide to Data Visualization Read More »

Prometheus: The Heart of Effective System Monitoring

A Roadmap for This Blog We’ll take a deep dive into Prometheus, covering the following key areas: What is Prometheus? Prometheus, originally created at SoundCloud in 2012, is an open-source toolkit for system monitoring and alerting. Over the years, it has gained wide adoption across various companies and organizations. This project boasts an active community …

Prometheus: The Heart of Effective System Monitoring Read More »

From Chaos to Clarity: An Intro to Monitoring with Prometheus and Grafana

Welcome to our guide on Prometheus and Grafana, your tools for achieving top-notch system monitoring and visualisation. Whether you’re a novice venturing into the world of DevOps or a seasoned pro looking to supercharge your monitoring capabilities, this blog has it all. The Significance of Proactive Monitoring In the world of DevOps, monitoring stands as …

From Chaos to Clarity: An Intro to Monitoring with Prometheus and Grafana Read More »

Scroll to Top