 Prometheus Plus Grafana
Now, we’ll dive into the synergy between Prometheus and Grafana, exploring how this dynamic duo creates a powerful monitoring and visualization solution.
But before we embark on this exciting journey, let’s recap what we’ve learned in the previous three blogs.
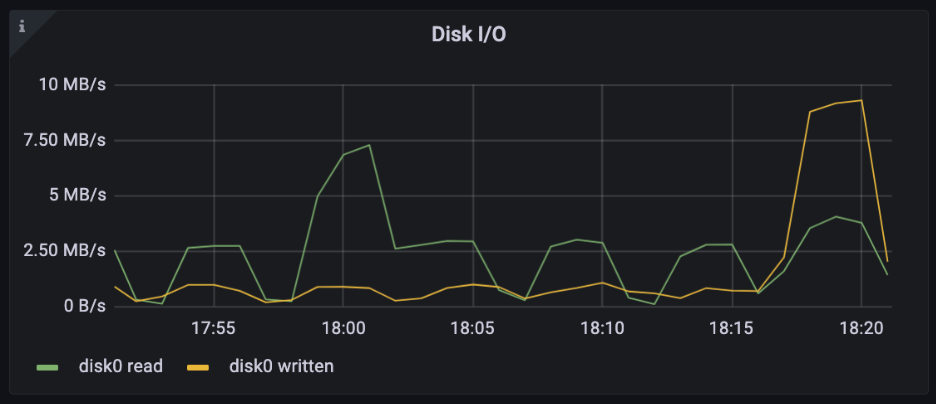
In this Grafana dashboard panel, you can see the current disk bandwidth usage on a laptop.
Prometheus as Data
It comes from Time series data, which pairs a moment in time on the X-axis with a numeric measurement on the Y-axis (e.g., 5 megabytes per second), and is ubiquitous in systems monitoring, as well as in applications like temperature charts and stock prices. It represents a continuous measurement over a series of time points.
Prometheus specializes in collecting and storing time series data. Its data model comprises metrics, including timestamps and numeric samples (e.g., disk bytes read or stock prices), and a set of labels known as dimensions (e.g., job and device). While you can store time series data in relational databases, these systems are not optimized for handling large volumes of such data. Prometheus and similar software offer tools to efficiently manage and optimize time series data storage and querying.
Simple Dashboard using PromQL
In the Grafana dashboard image below, you’ll find a Disk I/O graph displaying raw data obtained from Prometheus, sourced from a laptop.
The Metrics browser field features the following query:
node_disk_written_bytes_total{job="integrations/macos-node", device!=""}In this particular instance, the Y-axis illustrates the cumulative count of bytes written, while the X-axis displays chronological dates and times. As the laptop continues to operate, the graph reflects the incremental growth in the number of bytes written over time. Below the Metrics browser field, you’ll find a counter keeping track of the cumulative bytes written over time.
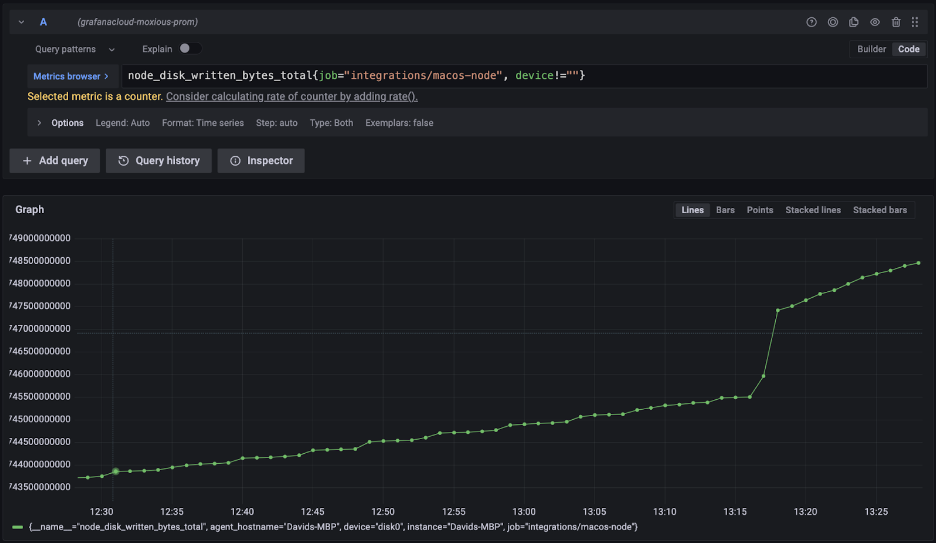
The query, written in PromQL (Prometheus Query Language), extracts the “node_disk_written_bytes_total” metric while specifying two labels, “job” and “device.” It filters metrics to include only those from the “integrations/macOS-node” job and requires the “device” label to be non-empty. This query yields the raw data displayed on the graph.
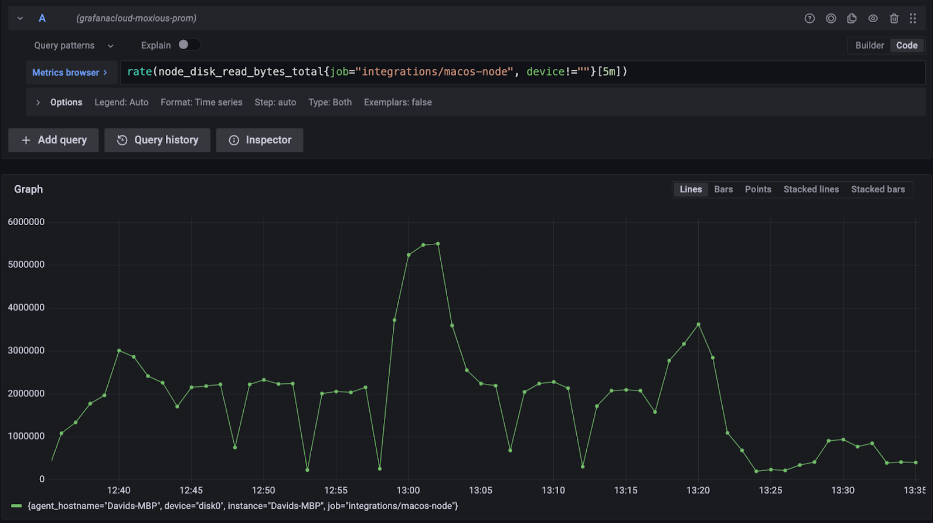
While this view offers some insights into system performance, a more comprehensive understanding necessitates observing the rate of change, indicating how quickly data writing is evolving. To effectively monitor disk performance, you can use PromQL’s “rate()” function, which calculates the per-second average rate of increase over 5-minute intervals. This perspective offers a clearer view of system activity, including spikes under load and potential disk performance concerns.
A counter metric is just one type of metric; it is a number (such as total bytes written) that only increases. Prometheus supports several others, such as the metric-type gauge, which can increase or decrease.
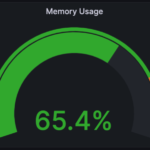
The following gauge visualization displays the total RAM usage on a computer.
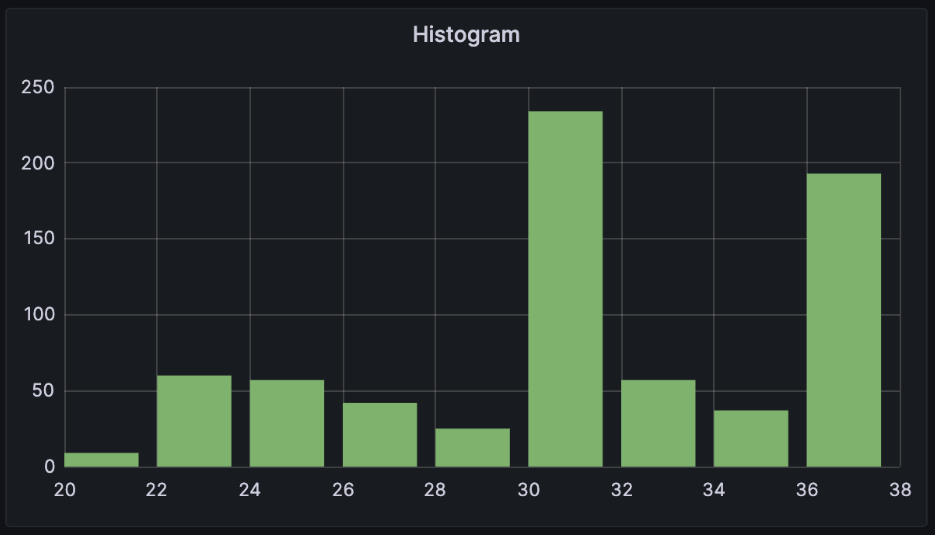
The third metric type is called a histogram, which counts observations and organizes them into configurable groups. The following example displays floating-point numbers grouped into ranges that display how frequently each occurred.
These core concepts of time series, metrics, labels, and aggregation functions are foundational to Grafana and observability.
Bringing it together
The powerful combination of Prometheus and the Grafana Agent affords you an unprecedented level of control over your metrics pipeline. It empowers you to determine which metrics you wish to collect, their precise origins, and where you intend to send them. As the data finds its way into Grafana, it can be securely stored within a Grafana Mimir database, ensuring a robust and accessible repository for your valuable metrics.
Grafana’s dynamic dashboards serve as the canvas for your data-driven story. These dashboards consist of a multitude of visualizations, each dynamically populated by data sourced from Prometheus. Here’s where the magic happens: the PromQL query language steps in to filter, manipulate, and aggregate the data, offering you tailored insights that precisely meet your requirements. It’s a process that seamlessly transforms raw numerical data, initially generated by your software systems, into actionable knowledge. This journey, from data inception to Prometheus, delivery to Grafana, refined by PromQL, and finally visualized within Grafana, is a testament to the power of this integrated approach in unlocking the full potential of your metrics ecosystem.
Conclusion
- In conclusion, Prometheus and Grafana form a dynamic duo that elevates your system monitoring and visualization capabilities to new heights. This comprehensive guide has provided insights into these open-source tools, showcasing their importance in the world of DevOps and beyond.
- Monitoring, guided by Prometheus, acts as your compass, steering you through the performance and health of your systems and applications. It empowers you to detect and address issues proactively, preventing them from escalating into outages or bottlenecks. With Prometheus, you gain reliability and a deep understanding of your infrastructure, even in challenging conditions.
- Grafana, on the other hand, transforms monitoring data into visually striking dashboards. These dashboards serve as a visual playground for tracking trends, spotting anomalies, and exploring patterns. They bring meaning to raw data, enabling teams to collaborate, identify root causes of incidents swiftly, and make data-driven decisions.
- Ready to supercharge your system monitoring and data visualization? It’s time to take action!
Call to Action
- Set Up Prometheus and Grafana: Your Comprehensive Guide
- Our blog provides detailed steps on how to install and configure Prometheus and Grafana for your monitoring needs. Don’t miss out on this invaluable resource.
- Unlock the full potential of Prometheus and Grafana. Empower your team with comprehensive monitoring and visualization tools. Take control of your system’s performance and make informed decisions.