
A Roadmap for this blog We’ll take a deep dive into Prometheus and Grafana setup, covering the following key areas:
- Prometheus setup
- Install Prometheus
- Point a domain name dedicated to prometheus
- Install nginx and configure reverse proxy
- Add SSL to nginx reverse proxy
- User Authentication layer to URL
- Grafana Setup
- Install Grafana
- Point a domain name dedicated to grafana
- Install nginx and configure reverse proxy
- Add SSL to nginx reverse proxy
- Node-Exporters
- Install node-exporter on the node
- Secure the port
- Prometheus Configuration
1. Prometheus setup:
Prometheus is a robust open-source monitoring tool that provides valuable insights into system health and performance. In this brief guide, we’ll show you how to set up Prometheus quickly for monitoring your infrastructure.
We’ll install Prometheus, configure it with a custom domain, implement an Nginx reverse proxy, secure it with SSL certificates for HTTPS, and establish user authentication to safeguard your metrics from unauthorised access.
1.1 Install Prometheus:
Begin by installing Prometheus on your Linux system with these commands:
sudo apt update
sudo apt install prometheus
Check Prometheus’s status to ensure it’s running:
sudo service prometheus status
Prometheus Node Exporter, which provides system metrics, is installed by default. Verify its status as well:
sudo service prometheus-node-exporter status
Prometheus serves metrics on port 9090 (http://<your_server_ip>:9090) and Node Exporter metrics on port 9100 (http://<your_server_ip>:9100). Ensure your firewall rules don’t block access to these ports.
1.2 Point a domain name dedicated to prometheus:
Obtain a subdomain, and then configure the A record to direct traffic to your server’s IP address.
This setup will grant you access to Prometheus through a user-friendly URL, such as http://domain_name:9090, making it more convenient to monitor your systems.
After this step, we were able to access prometheus through the URL: http://domain_name:9090
1.3 Install nginx and configure reverse proxy:
To streamline your Prometheus access, we’ll install Nginx and implement a reverse proxy.
This solution ensures that you won’t have to include port numbers in your domain when accessing Prometheus, enhancing the usability of your monitoring setup.
Install Nginx with the following command:
sudo apt install nginx
Navigate to the Nginx sites-enabled directory:
cd /etc/nginx/sites-enabled
Create a new configuration file for Prometheus:
sudo nano prometheus
In the configuration file, paste the following:
server {
listen 80;
listen [::]:80;
server_name <you-domain-name>.com;
location / {
proxy_pass http://localhost:9090/;
}
}
Let’s break down the configuration:
listen 80; and listen [::]:80;: This specifies that the server should listen on port 80 for incoming HTTP requests. The [::] notation is used for IPv6.
server_name <Domain>: This directive associates the configuration with the specified domain name. Only requests with this domain name will be handled by this server block.
location / { … }: This block defines the behaviour for requests that match the root location /. In this case, it’s a reverse proxy setup.
proxy_pass http://localhost:9090/;: This directive tells Nginx to forward incoming requests to the backend server running at http://localhost:9090/. The trailing slash / after the port number in the proxy_pass directive indicates that the original URI from the client request will be appended to the URL being forwarded to the backend server. For example, if a request is made to http://YOUR-DOMAIN-NAME/some/path, Nginx will forward it to http://localhost:9090/some/path.
Restart Nginx:
sudo service nginx restart
sudo service nginx status
Visit your domain at http://<your-domain-name>.com. You should now be greeted by the Prometheus web page, confirming that your reverse proxy configuration is working as expected.
Now you can access prometheus on the given domain name.
1.4 Add SSL to nginx reverse proxy
To enhance security, we’ll add transport encryption to the Prometheus web user interface. We obtained a free SSL certificate from Let’s Encrypt using Certbot. However, before proceeding, ensure domain name has fully propagated across the internet, as DNS changes can take some time.
On your server, execute the following commands:
Install or update essential components:
sudo snap install core; sudo snap refresh core
Install Certbot in classic mode:
sudo snap install --classic certbot
Create a symbolic link for Certbot:
sudo ln -s /snap/bin/certbot /usr/bin/certbot
Now, you can use Certbot to obtain and install your SSL certificate:
sudo certbot --nginx
Follow the prompts and select the domain name you want to secure with the certificate.
To see the changes in the Nginx Prometheus config file we created earlier, open it with the following command:
sudo nano /etc/nginx/sites-enabled/prometheus
These steps will ensure that your Prometheus web interface is securely accessible over HTTPS, enhancing the overall safety of your monitoring setup.
Now certbot will renew your certs.
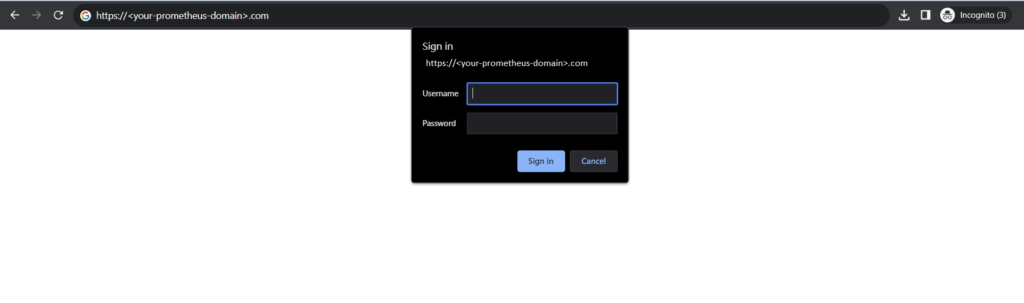
1.5 User Authentication Layer To URL:
While Prometheus is now accessible via the domain name, note that anyone with the domain can access the metrics. To address this, let’s introduce a user authentication layer.
Follow these steps to add a User Authentication layer to it.
Access Your Server: SSH into your server and navigate to the /etc/nginx directory:
cd /etc/nginx
Install Required Tools:
sudo apt install apache2-utils
Create a Password File: Generate a password file. In the example below, we’re creating a user named ‘admin’:
htpasswd -c /etc/nginx/.htpasswd admin
Modify Nginx Prometheus Configuration: Open the Nginx Prometheus configuration file that we created earlier:
sudo nano /etc/nginx/sites-enabled/prometheus
Paste this:
server {
listen 80;
listen [::]:80;
server_name <your-domain-name>.com;
#addition authentication properties
auth_basic “Protected Area”; #just a string can be used anything instead
auth_basic_user_file /etc/nginx/.htpasswd;
location / {
proxy_pass http://localhost:9090/;
}
}
Restart Nginx:
sudo service nginx restart
While your URL is now protected, it’s important to prevent direct access to Prometheus via IP and port numbers. To achieve this:
Block Ports 9090 and 9100: Use your firewall to block external access to ports 9090 and 9100, ensuring that these ports cannot be accessed directly from outside your network.
Local Accessibility: Ensure that these ports remain accessible locally if necessary for system monitoring and management. #important
2. Grafana setup:
2.1: Install Grafana:
To broaden our monitoring capabilities, we’ll now proceed to install and configure Grafana on the same node.
Prepare for Installation:
sudo apt-get install -y apt-transport-https
sudo apt-get install -y software-properties-common wget
Download Grafana GPG Key:
sudo wget -q -O /usr/share/keyrings/grafana.key https://apt.grafana.com/gpg.key
Add Grafana Repository:
echo "deb [signed-by=/usr/share/keyrings/grafana.key] https://apt.grafana.com stable main" | sudo tee -a /etc/apt/sources.list.d/grafana.list
Update Package List:
sudo apt-get update
Install Grafana:
sudo apt-get install grafana
Start Grafana Service:
sudo systemctl start grafana-server
Your Grafana server will be hosted at:
http://<your Grafana server IP>:3000
The default Grafana login is:
Username : admin
Password : admin
We get the option to update password upon first login and then be presented with the option to add a new data source and create dashboards and users.
Also, do systemctl enable to prom and grafana service so that they will be enabled by even after reboot.
2.2 Point a domain name dedicated to Grafana:
Obtain a subdomain, and then configure the A record to direct traffic to your server’s IP address.
This setup will grant you access to Grafana through a user-friendly URL, such as http://domain_name:3000, making it more convenient to monitor your systems.
After this step, we were able to access prometheus through the URL:
http://<your-domain-name>com:9090
2.3 Configure reverse proxy:
Navigate to the Nginx sites-enabled directory:
cd /etc/nginx/sites-enabled
Create a new configuration file for Prometheus:
sudo nano grafana
In the configuration file, paste the following:
server {
listen 80;
listen [::]:80;
server_name <your-grafana-domain-name>.com;
location / {
proxy_pass http://localhost:3000/;
}
}
2.3 SSL apply:
sudo certbot --nginx
You can access Grafana at https://<your-grafana-domain-name>.com
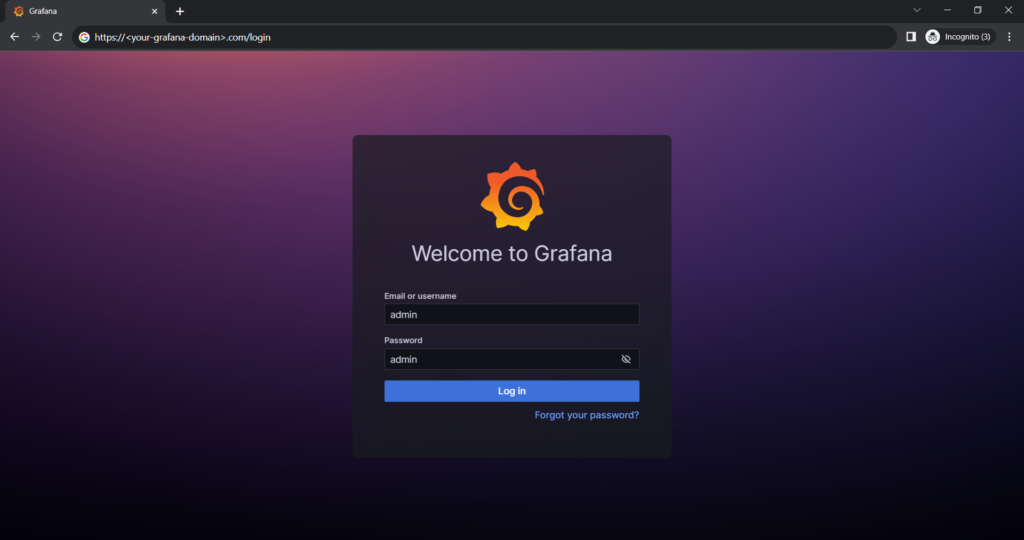
The default Grafana login is:
Username : admin
Password : admin
We get the option to update password upon first login and then be presented with the option to add a new data source and create dashboards and users.
3. Node-exporters
The Prometheus Node Exporter is a Prometheus exporter that exposes a wide variety of hardware- and kernel-related metrics from *NIX systems. It is written in Go and can be deployed on any *NIX system, including Linux, macOS, and FreeBSD.
The Node Exporter exposes metrics for the following: CPU usage, Memory usage, Disk usage, Network traffic, File system stats, Process stats, Kernel stats And more.
We will configure the node-exporter in frontend, backend and monitoring node to get the health of the NODE.
3.1: Install node-exporter on the Node.
sudo apt-get prometheus-node-exporter
3.2: Secure the port (This configuration currently is done via firewall rules)
Now, we want 9100 port of node-exporter to be accessible by only <your-prometheus-domain-name>.com.
Go to firewall rules, and allow 9100 port to be accessible only by the IP of Monitoring Node.
Now, we have node exporter on Backend server, Frontend server, and Monitoring Node.
The metrics right now being scraped are All Frontend, Backend, Monitoring Node metrics.
4. Prometheus Configuration:
Now that we have prometheus and grafana setup done, along with it node exporters are exporting metrics of respective nodes, we can configure prometheus config file to scrape these metrics.
Open the Prometheus configuration file in a text editor:
sudo nano /etc/prometheus/prometheus.yml
Scroll down to the bottom of the file and add a new scrape target to the existing node job. The new scrape target should be the IP address or domain name of the new node exporter, followed by the port number (9100).
For example:
– job_name: ‘node’
static_configs:
– targets: [‘localhost:9100’]
– targets: [‘other-server-ip-or-domain:9100’]
Save the file and exit the text editor.
Check the syntax of the configuration file.
promtool check config /etc/prometheus/prometheus.yml
If the syntax is correct, restart the Prometheus service:
sudo service prometheus restart
Check the status of the Prometheus service:
sudo service prometheus status
You can add many node-exporters on various servers and add them as targets in /etc/prometheus/prometheus.yml
Below you can see multiple targets added as metrics input to prometheus.
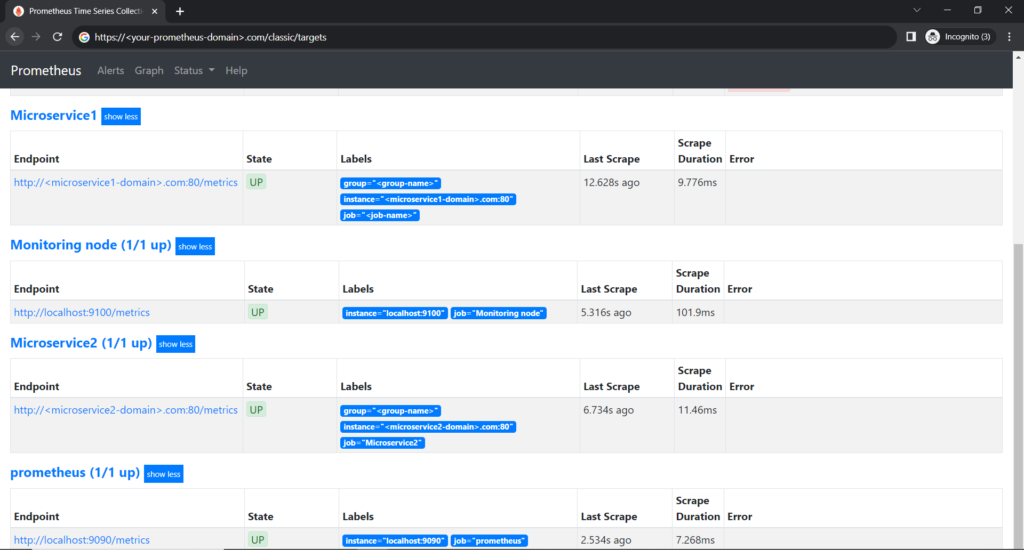
All these metrics can be used to Create a Grafana Dashboard.